Eight tools.
One intelligent dashboard.
Every screen designed around a real question a portfolio landlord asks — not a feature checklist.
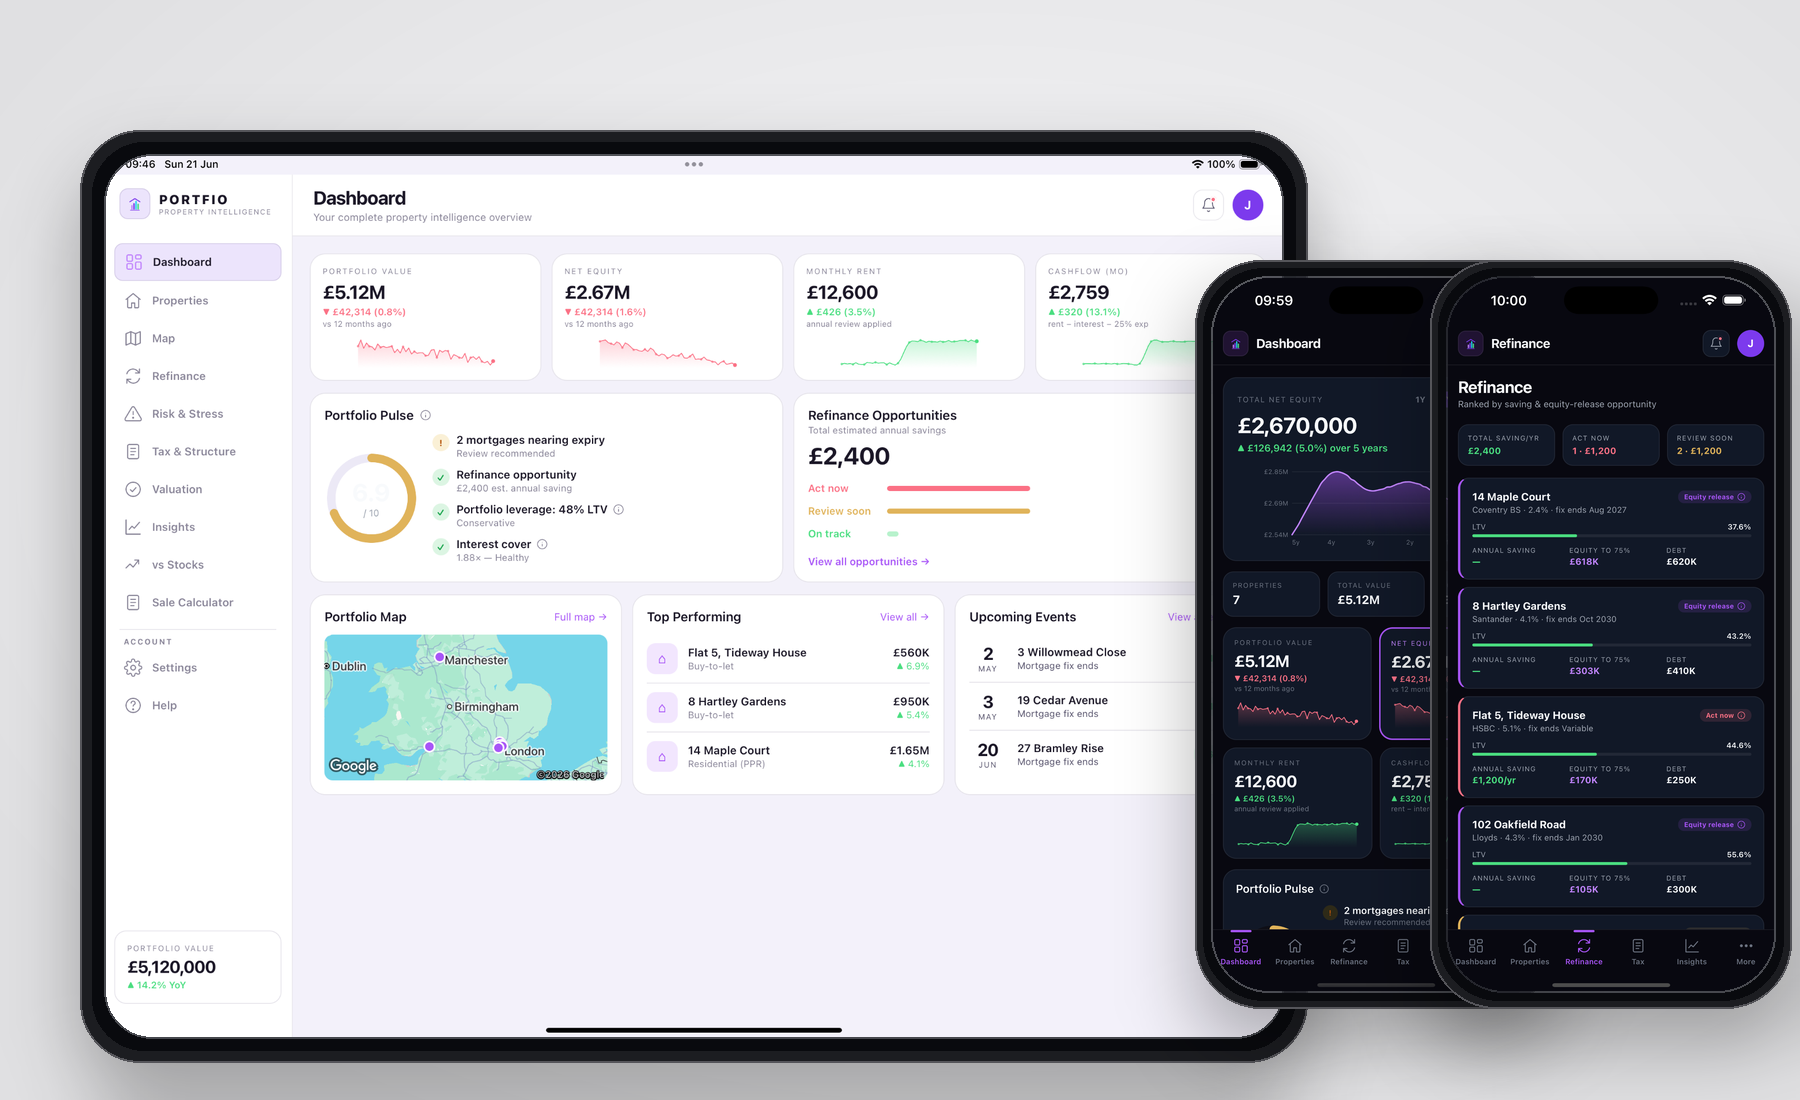
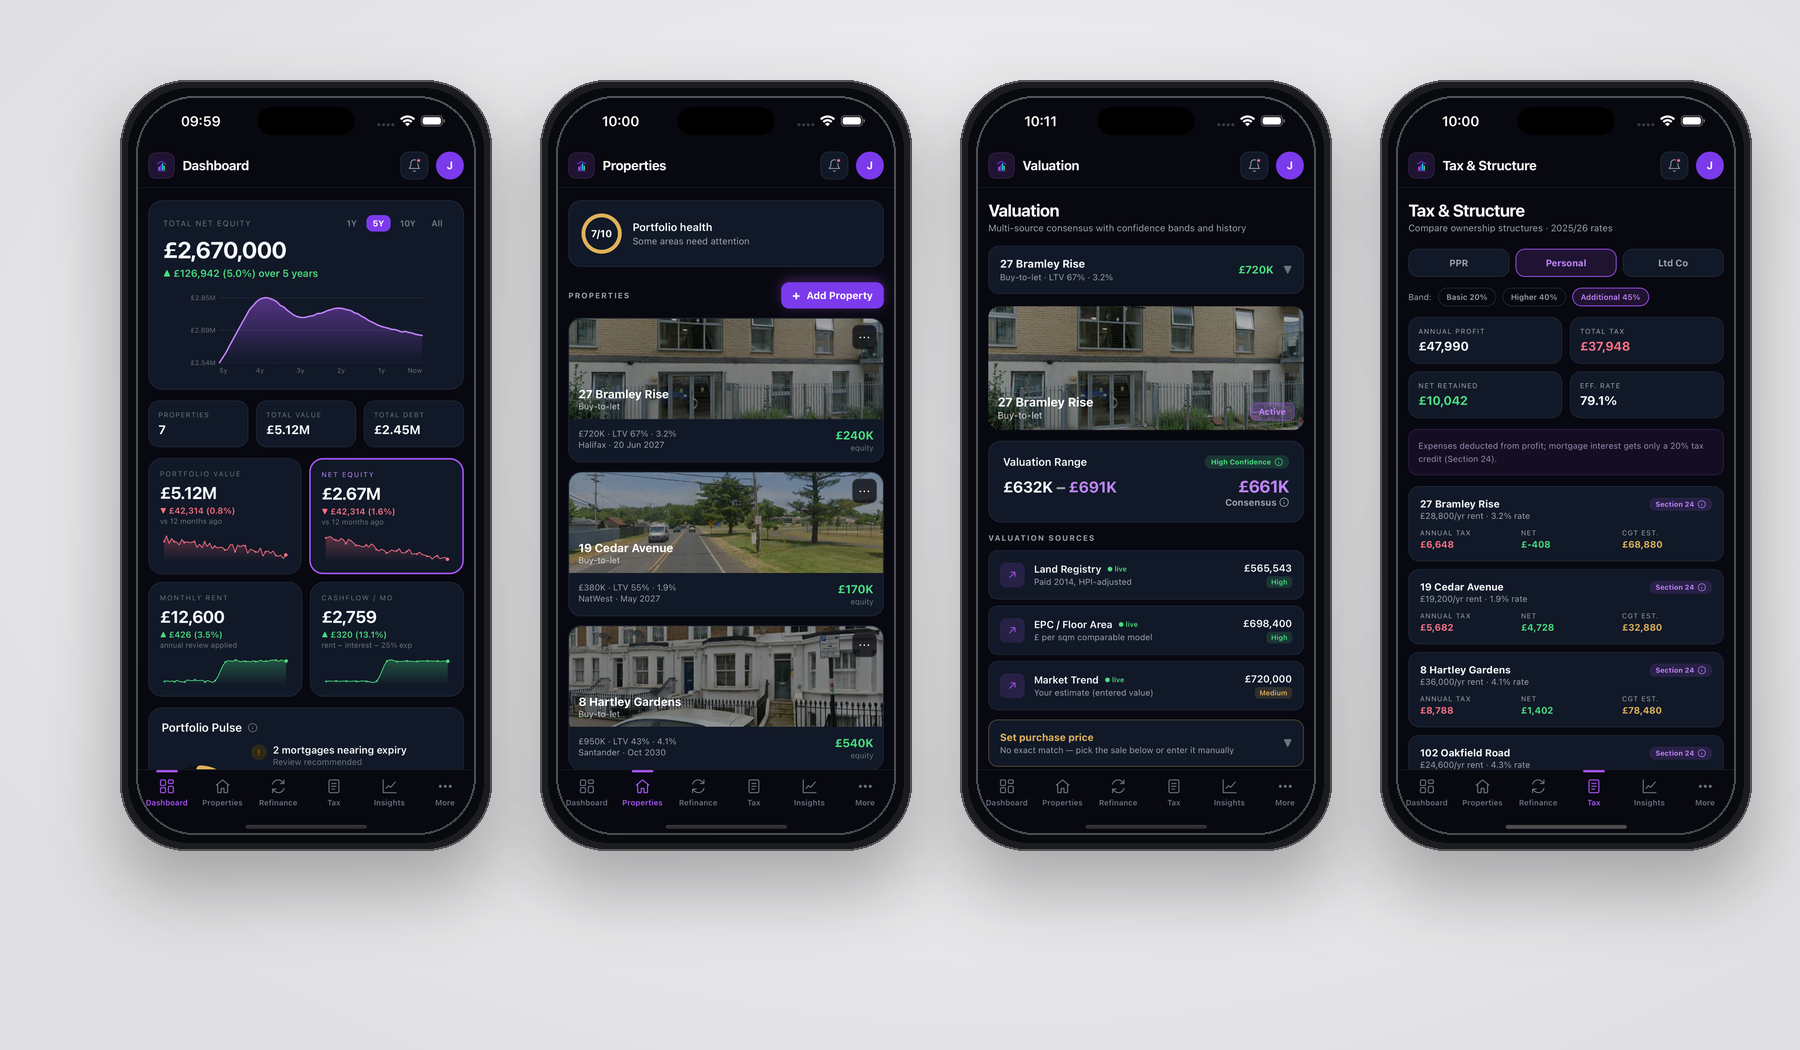
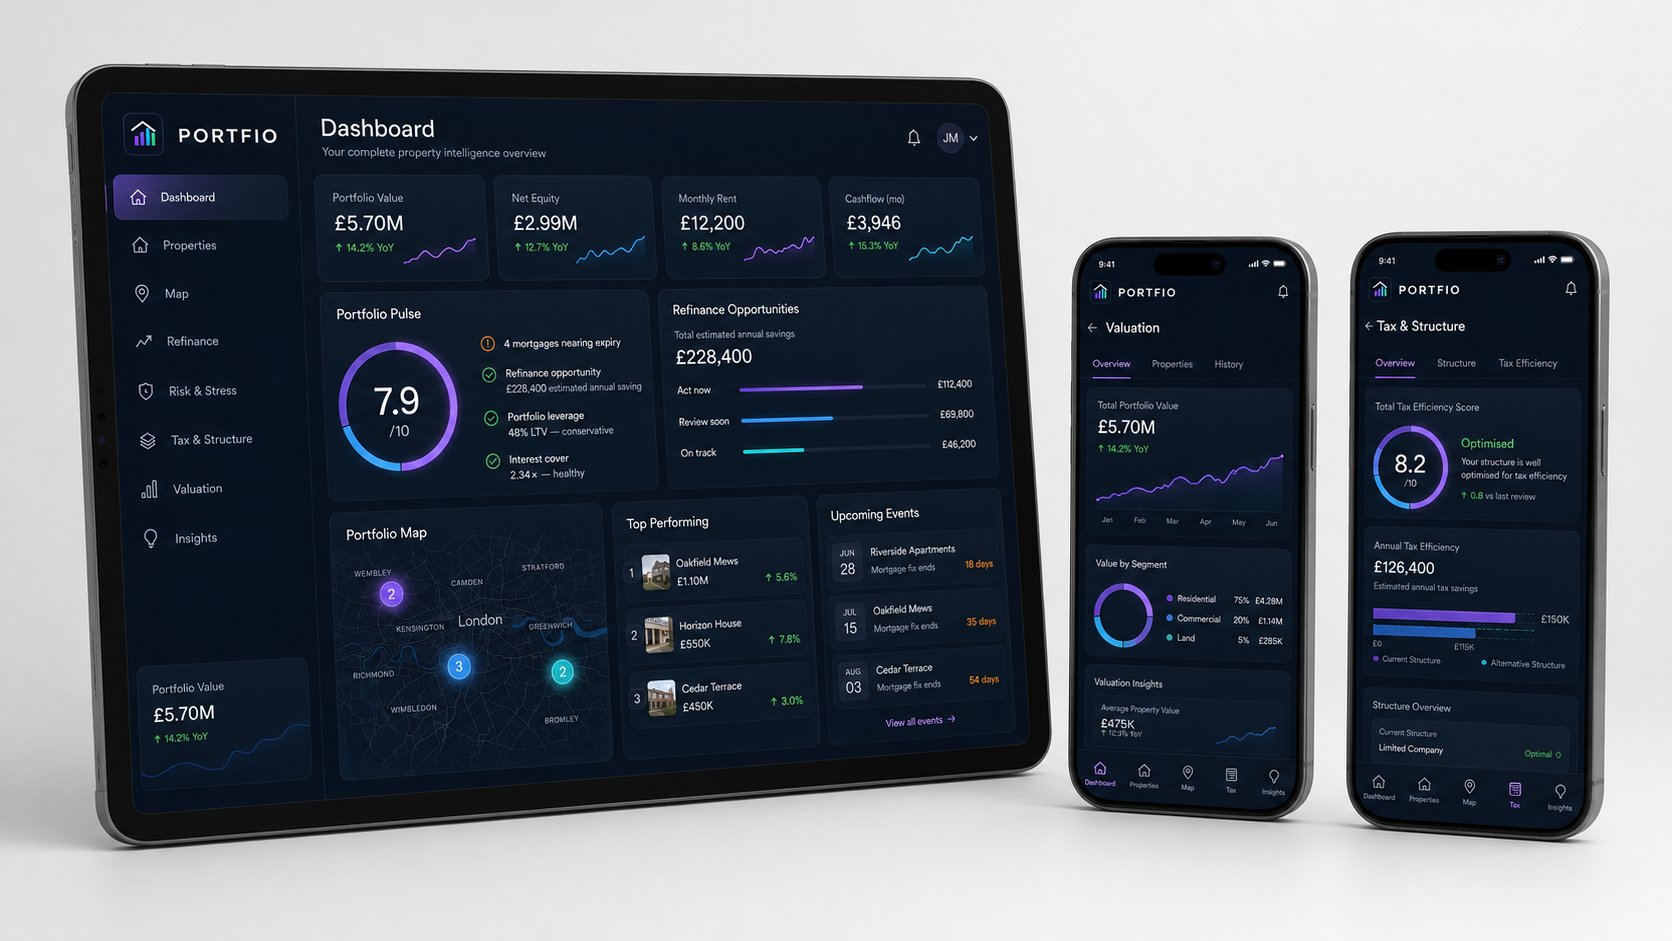
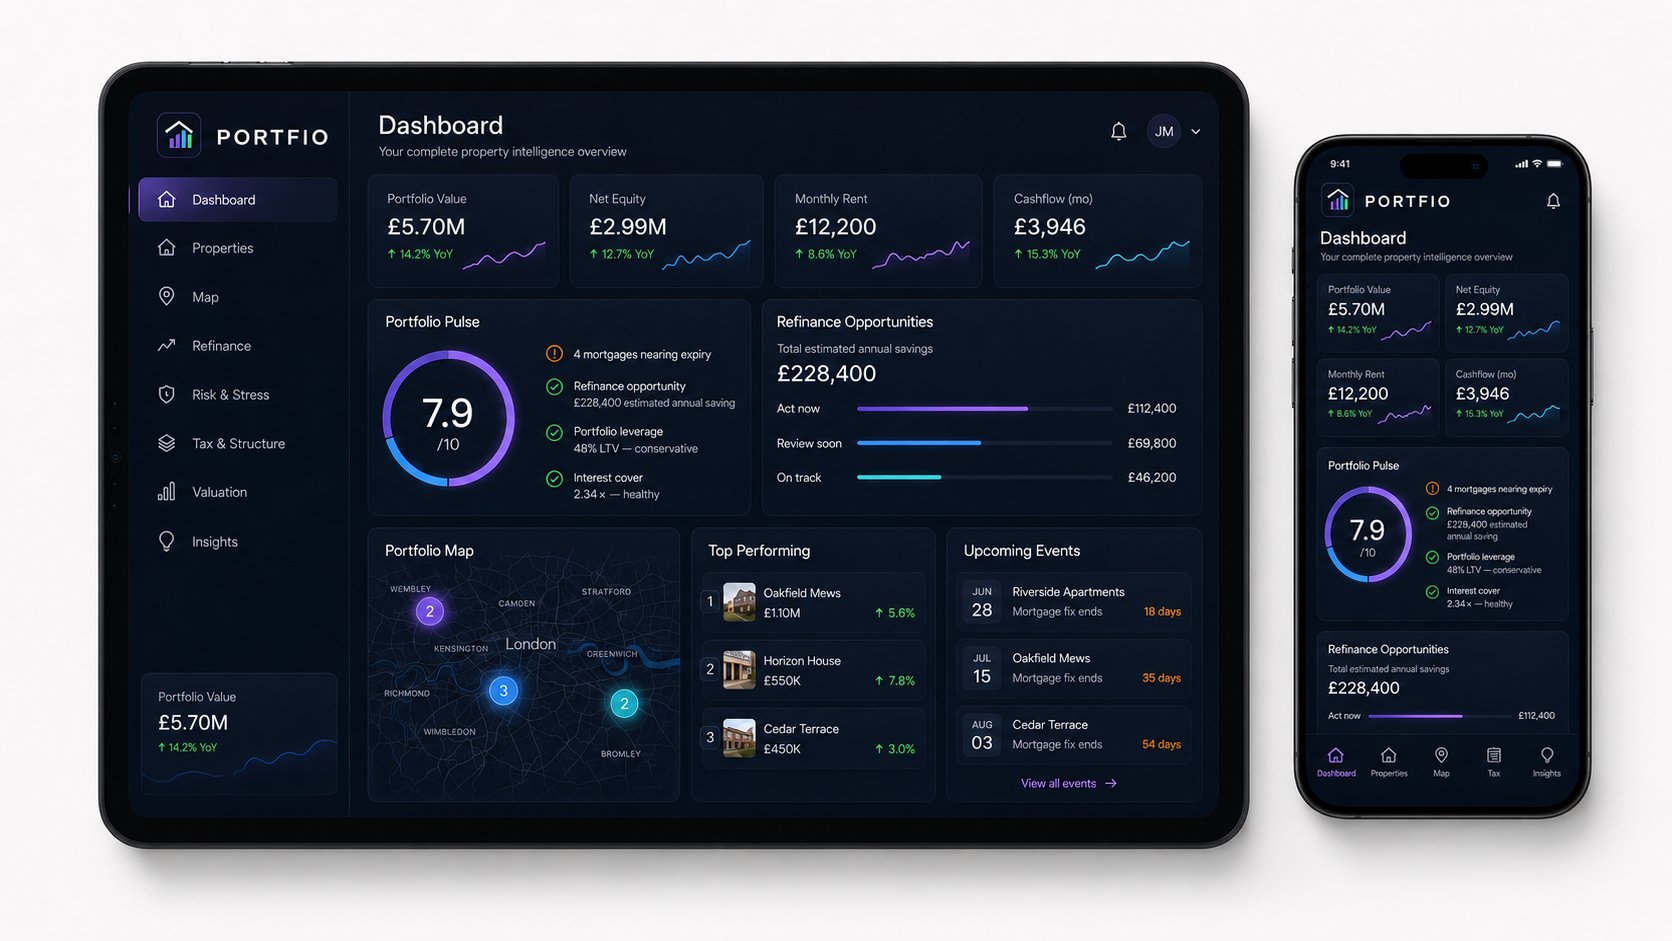
One screen, the whole picture.
Net worth, total equity, monthly rent and cashflow at the top. Portfolio Pulse — a 0–10 health score weighted across leverage, interest cover, refinance pressure, rate exposure and concentration. Refinance opportunities ranked by saving. Map view of every property. Top performers and upcoming events.
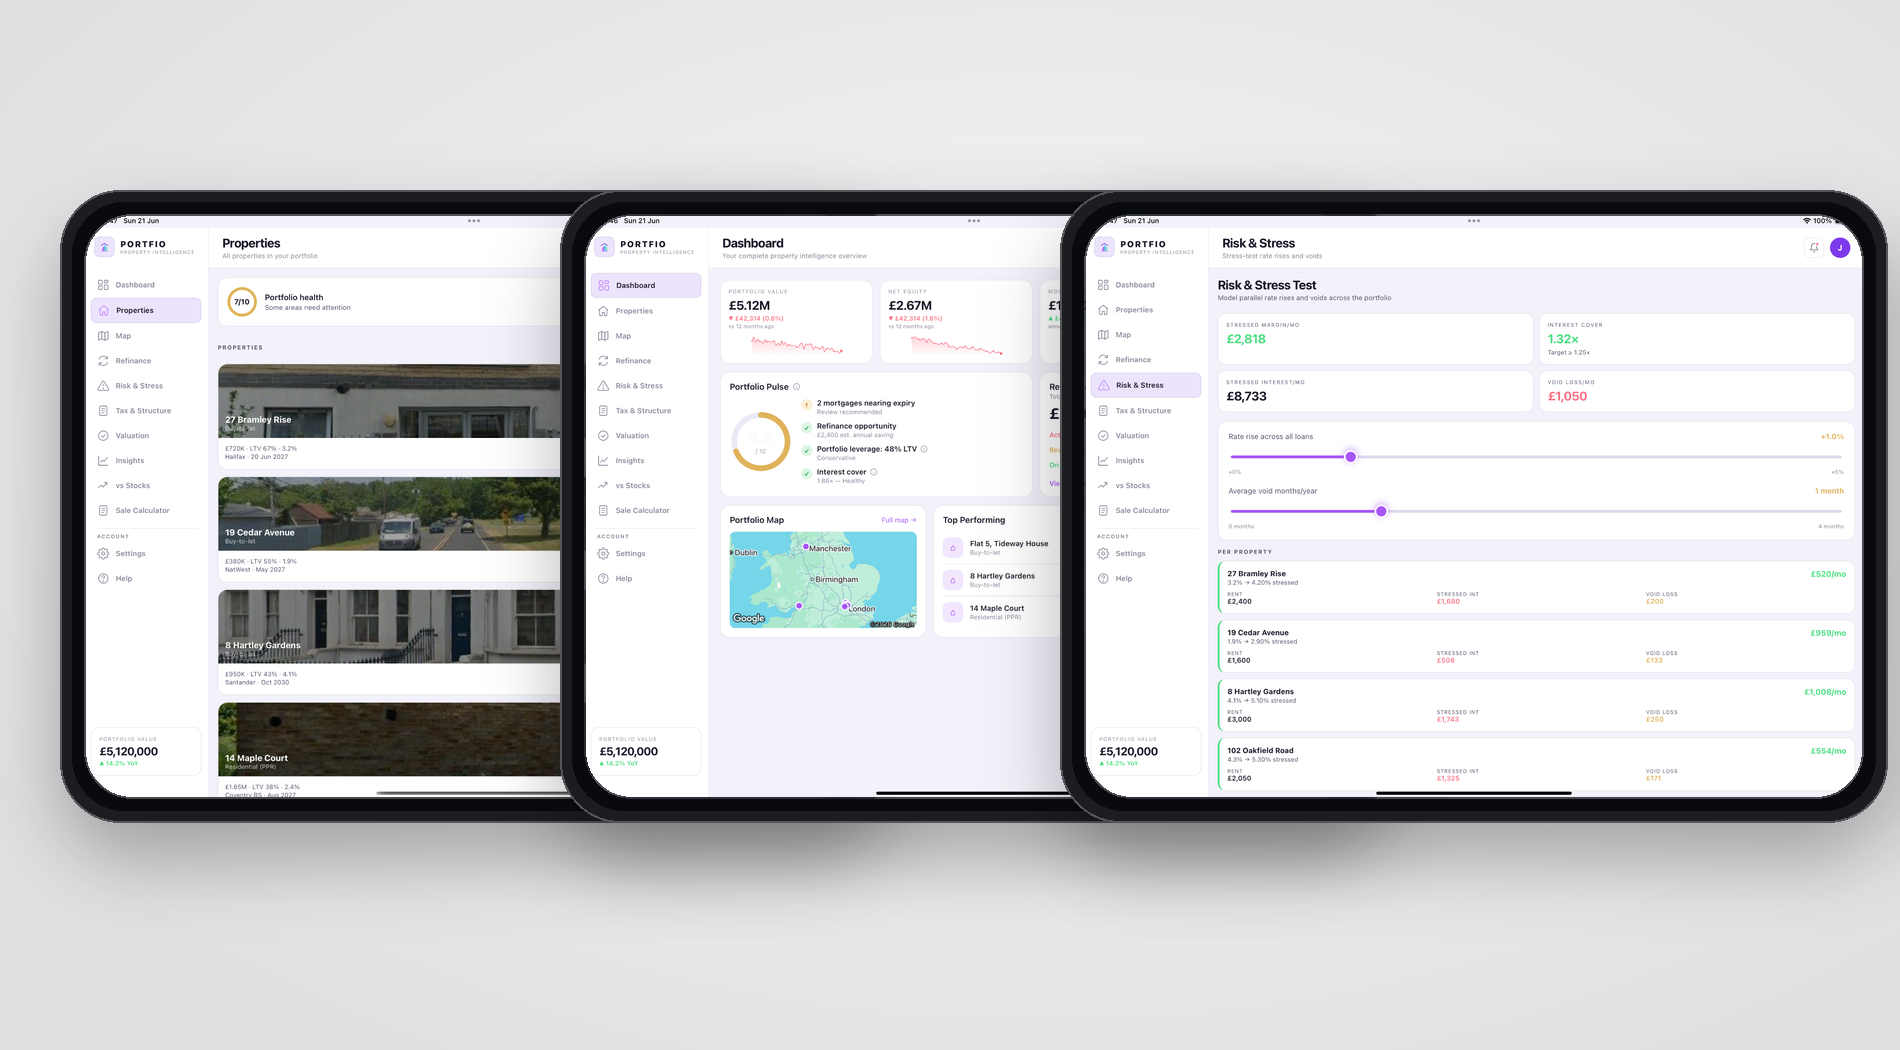
Every property, ranked and understood.
Track each property's value, LTV, mortgage rate, equity, lender and fix-end date. Tap a card to see the full property detail page with valuation history, tax position, refinance options and document storage.
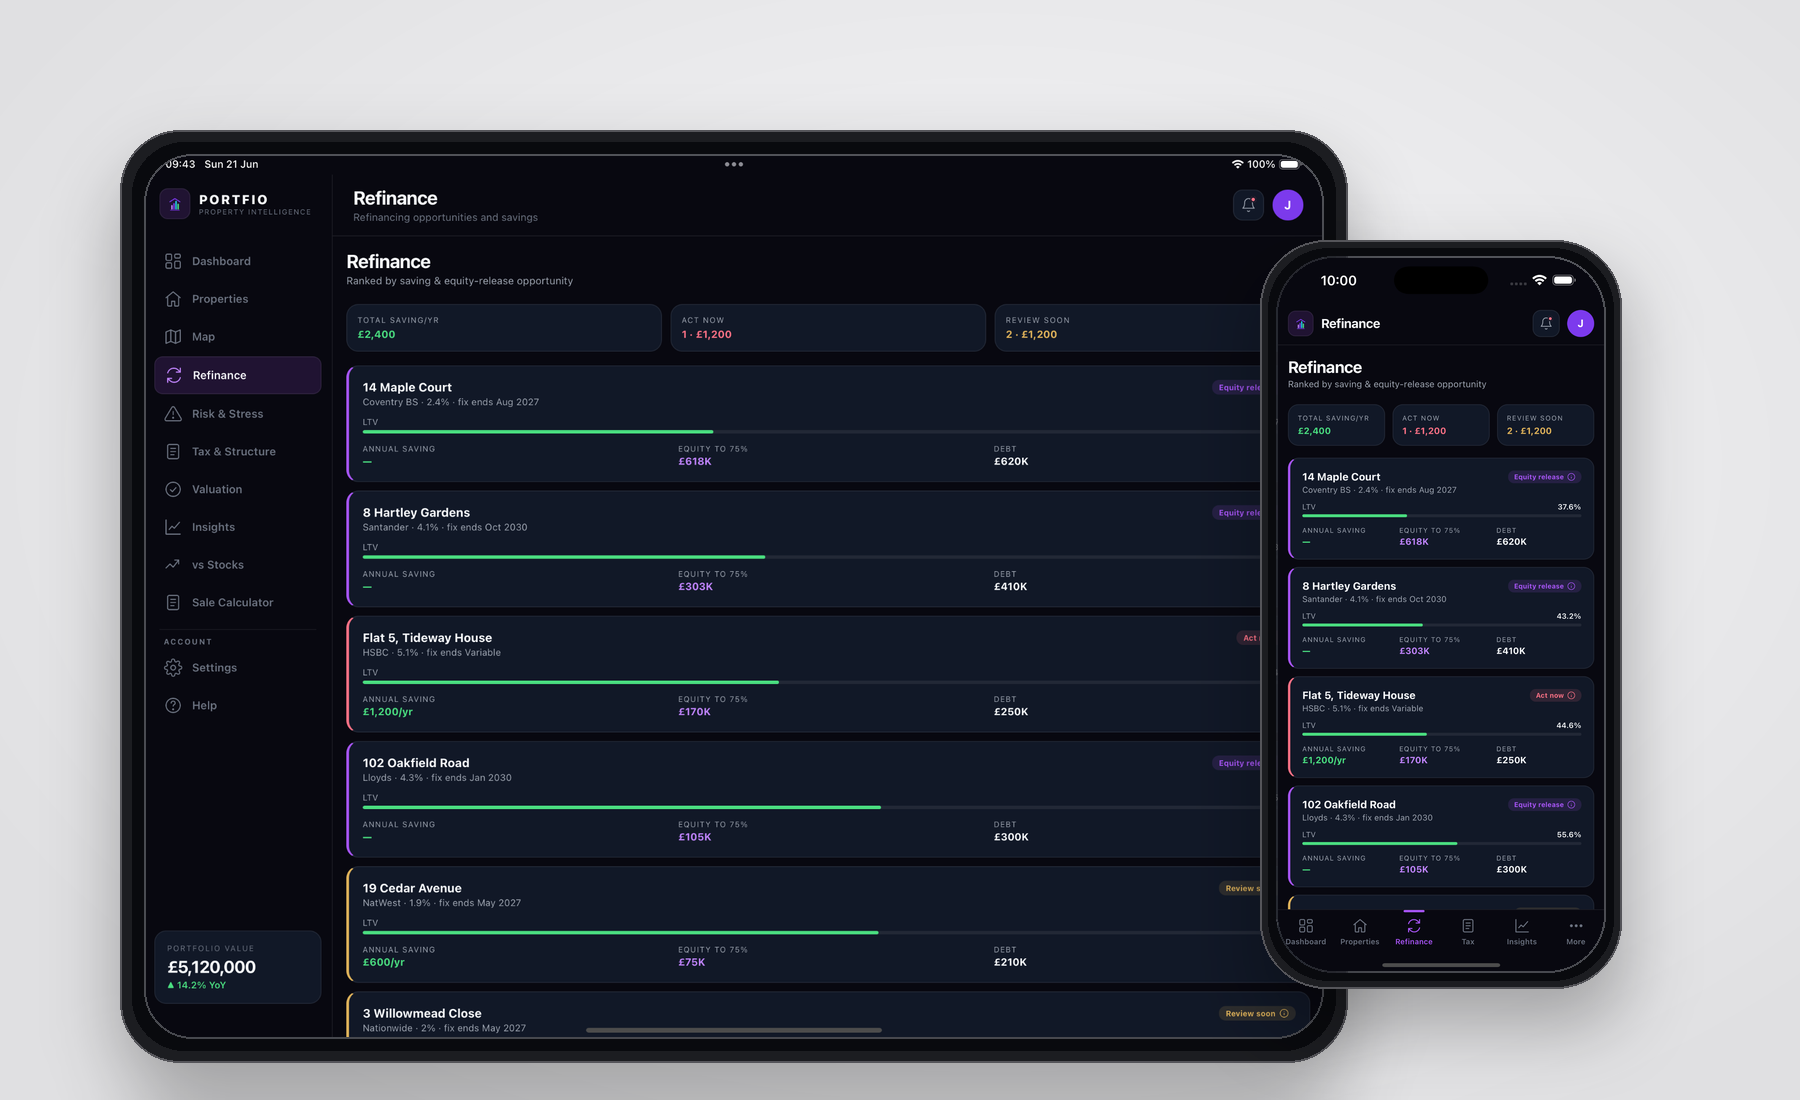
Spot refinance opportunities before they cost you.
Every property scored on annual saving and equity-release opportunity. Status flags for "Act now", "Review soon", "Equity release" or "On track". Aggregated totals show what's at stake across the whole portfolio.
Compare PPR, personal and limited company structures.
Model your tax position across ownership structures with proper Section 24 interest restriction, marginal-rate corporation tax, and selectable dividend extraction modes. Built for UK 2025/26 HMRC rates.
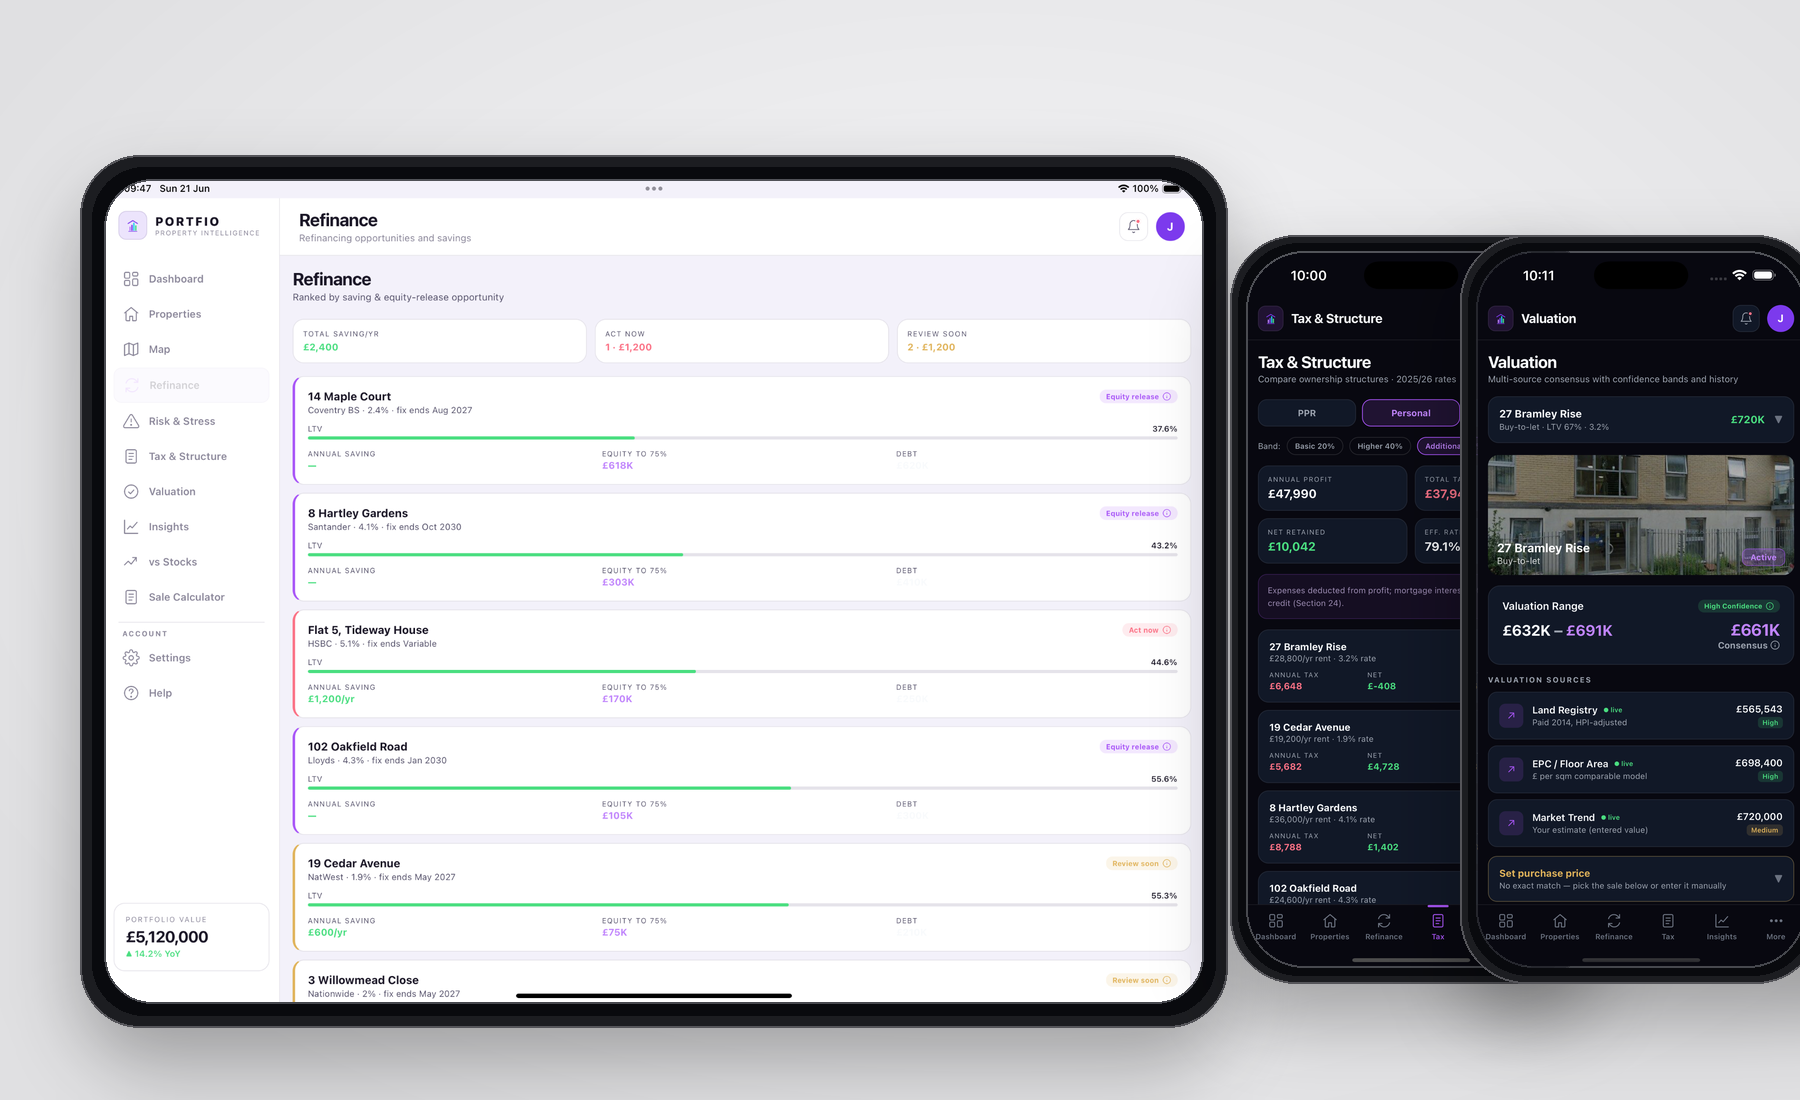
Three sources, one consensus.
Each property valuation combines HM Land Registry sold price uprated by ONS HPI, an EPC floor-area model, and a market trend. Confidence band, high/low range and full historic curve — not a single number.
How resilient is your portfolio, really?
Stress-test against interest-rate shocks (+1%, +2%, +3%), rent reductions and vacancy increases. Key risk metrics — Portfolio LTV, Interest Cover Ratio, Debt Yield, Refinance Exposure — with traffic-light banding.
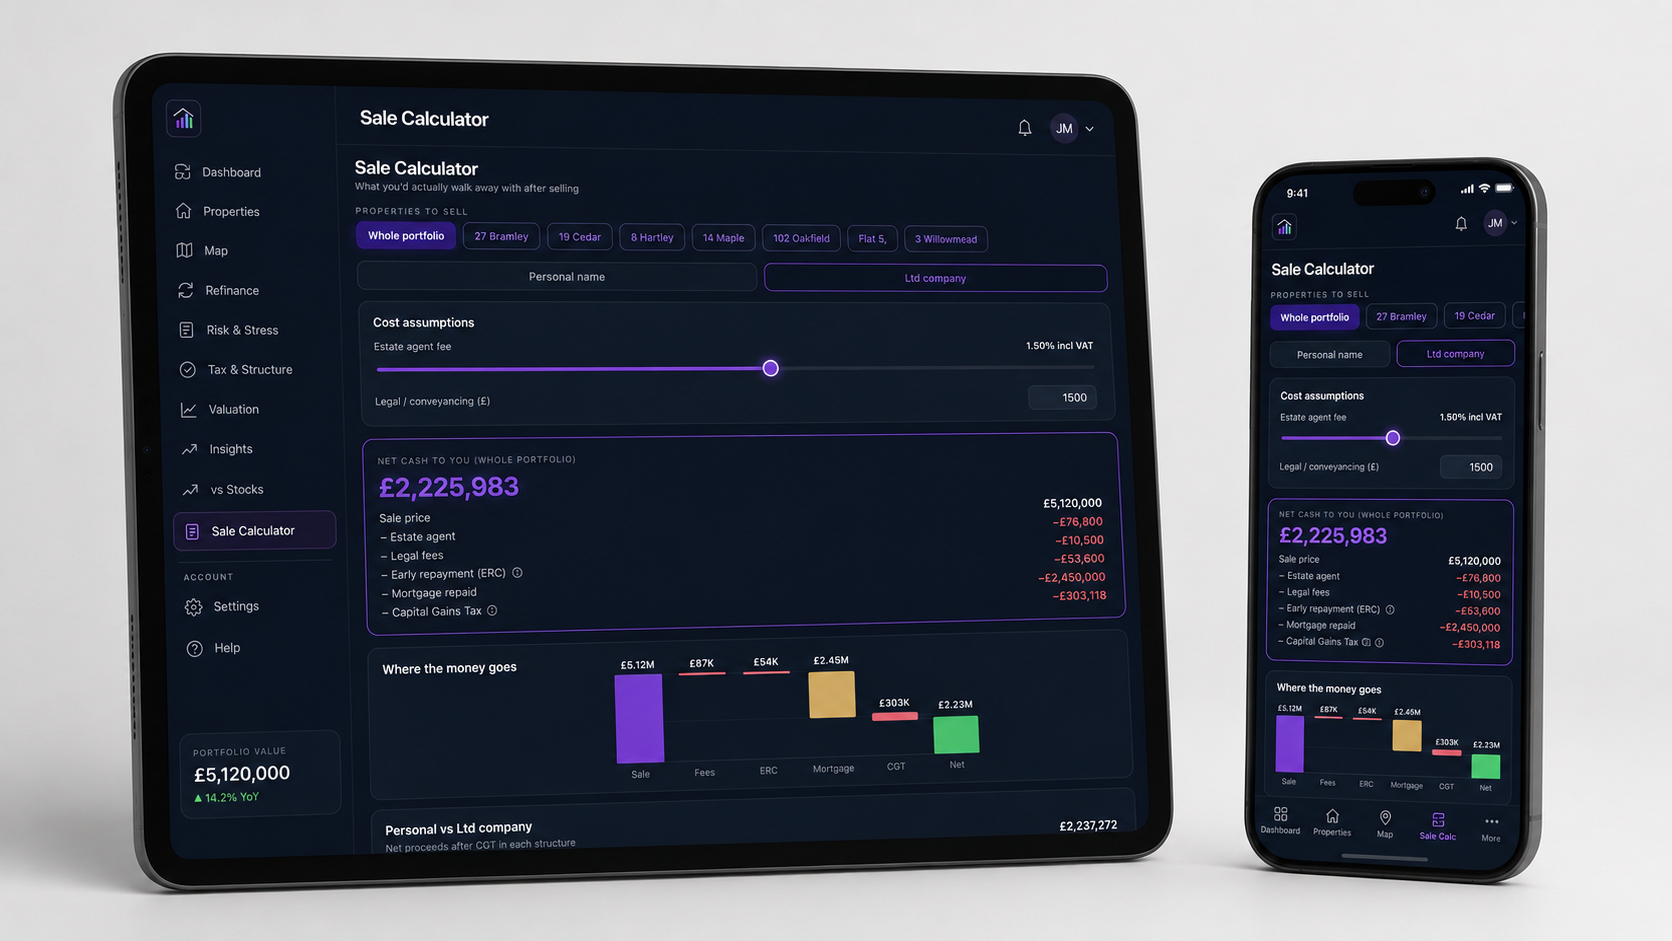
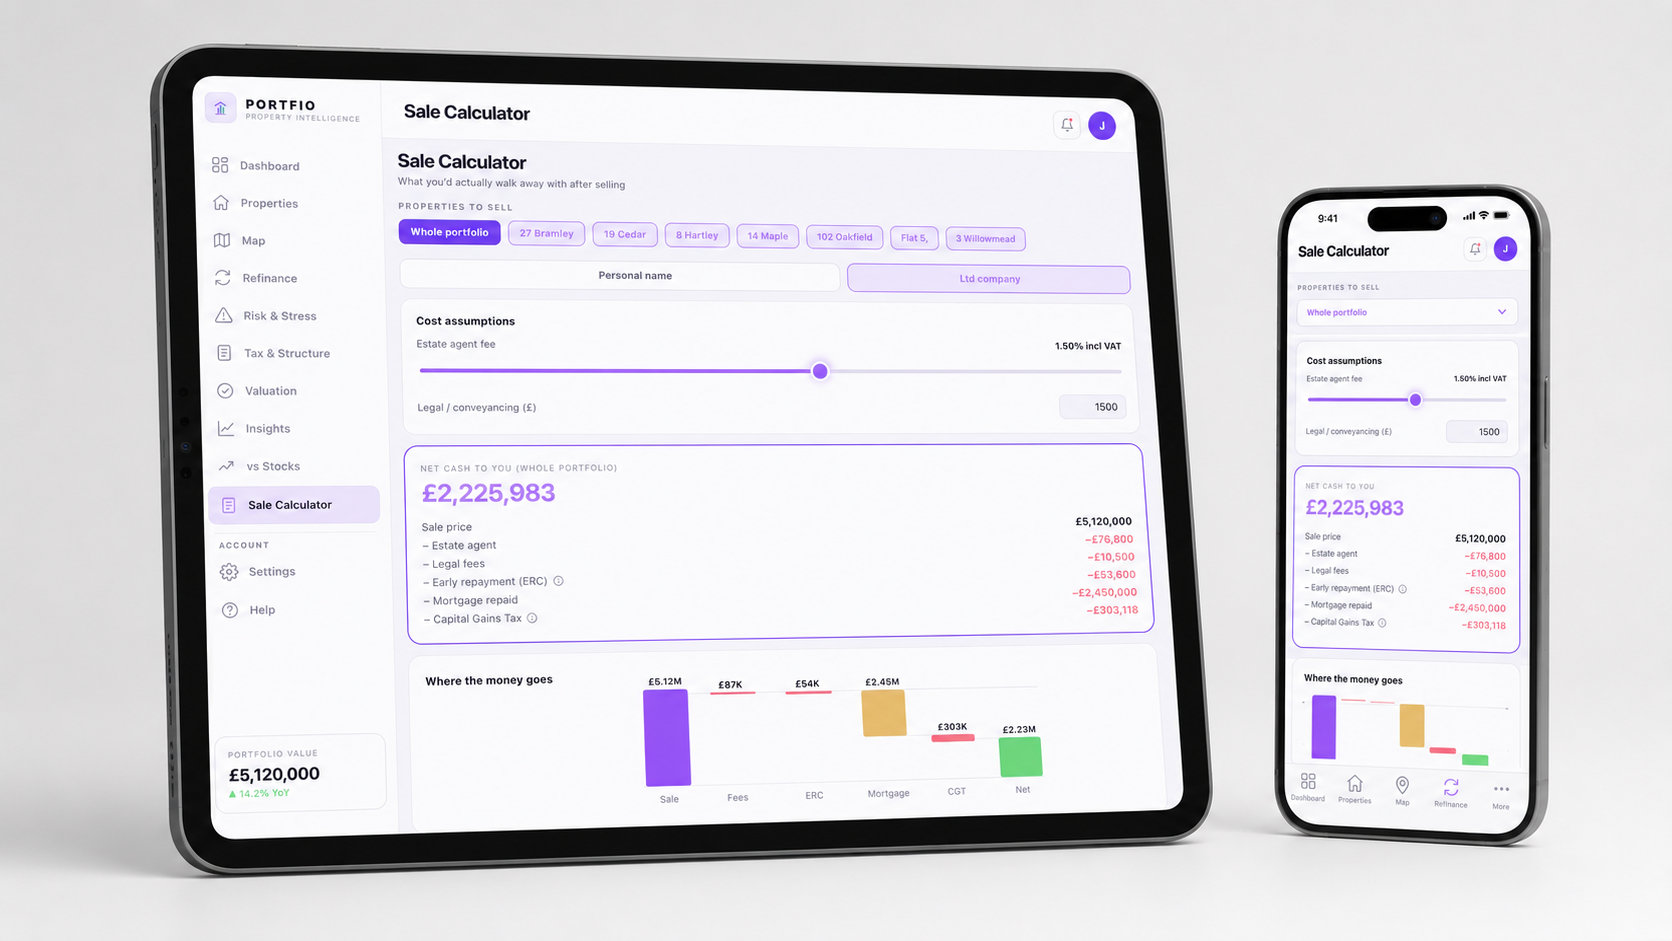
Know what you'd actually walk away with.
Model sale price, estate agent fees, legal costs, mortgage repayment, Early Repayment Charges, and CGT — for one property or your whole portfolio. Personal name vs Ltd company side-by-side.
Was property the better use of your capital?
Track how your portfolio equity has performed against MSCI World, S&P 500 and FTSE 100 over the same period. Toggle starting point — your real cash in (deposits) or your equity at the start.
See it on your portfolio.
Download Portfio and add your first property in under two minutes.